 RockCloud-基石云安全-官方博客
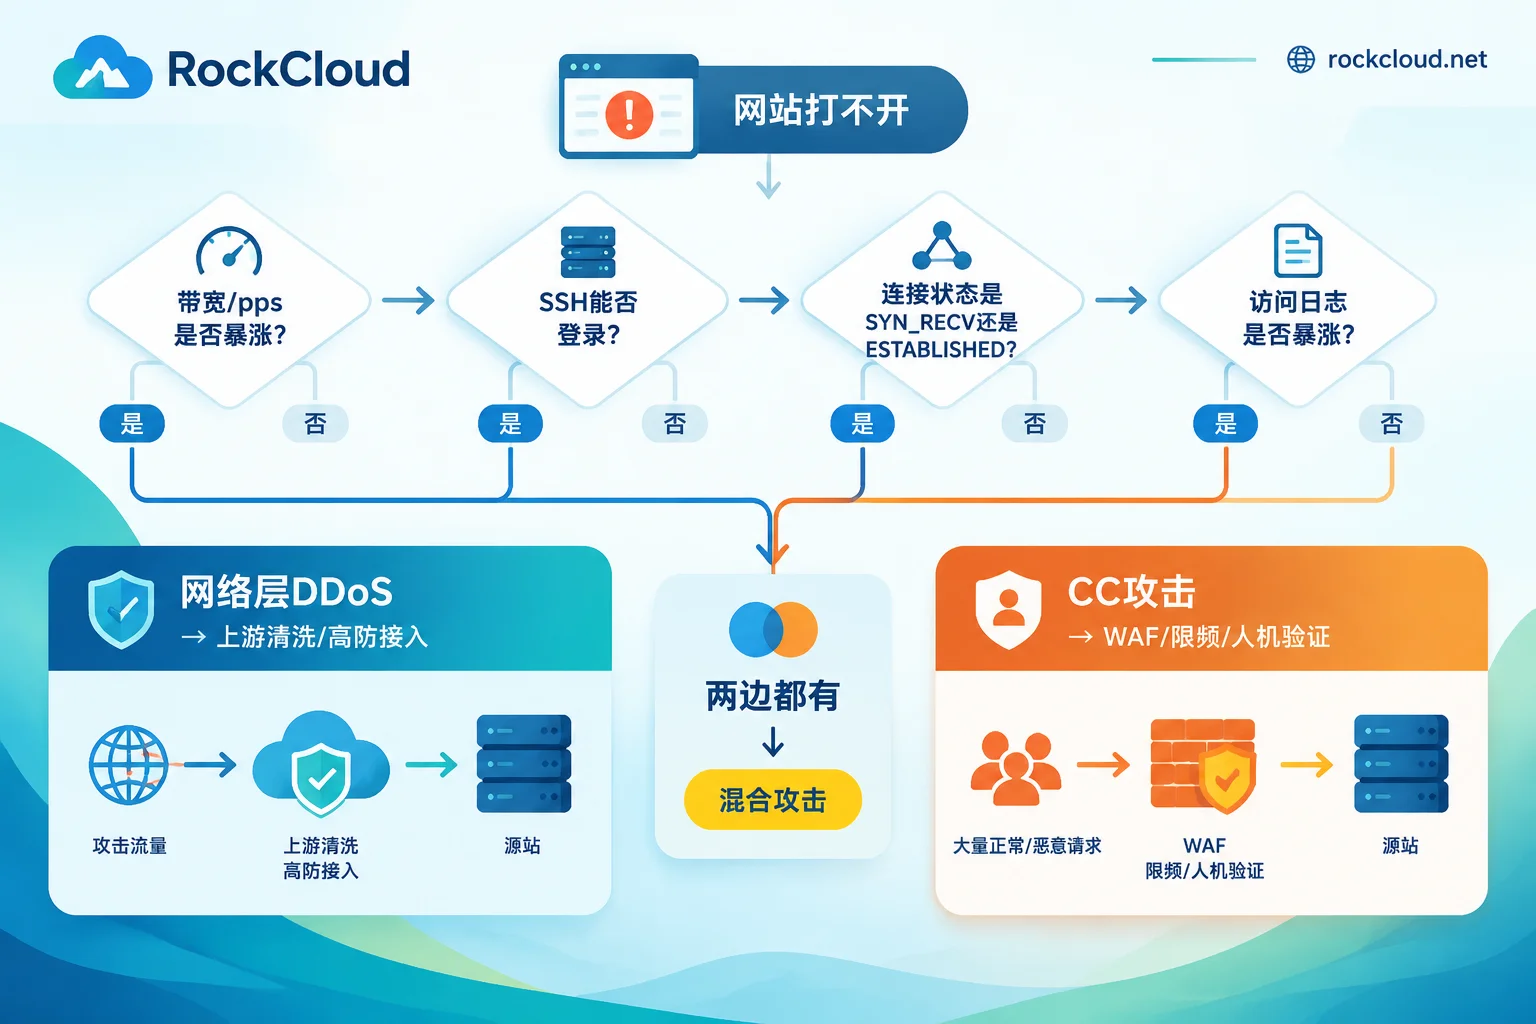
When a website suddenly goes down, first check three things: whether bandwidth and packet volume have spiked, whether you can still log in to the server, and whether the access logs show a large number of requests.
- Bandwidth and packets per second (pps) spike, SSH cannot connect or is very laggy, while Nginx/Apache logs are quiet: most likely a network-layer/transport-layer DDoS (SYN Flood, UDP Flood, reflection amplification, etc.).
- Bandwidth has not increased much, the server can be logged into but CPU stays near 100% for a long time, and access logs grow wildly: most likely a CC attack, i.e. an application-layer (L7) HTTP/HTTPS Flood.
- Both characteristics appear at the same time: handle it as a mixed attack.
Identify the type before acting, because the response directions differ: for network-layer DDoS, adding rules on the origin server is basically useless—upstream scrubbing is needed; for CC attacks, simply expanding bandwidth is useless—identification and rate limiting must be done at layer 7.
Step 1: Check bandwidth and QPS in monitoring
Open the monitoring of your cloud provider, data center, or gateway, and look at layer 4 bandwidth (bps), packet volume (pps), layer 7 QPS, and concurrent connections together:
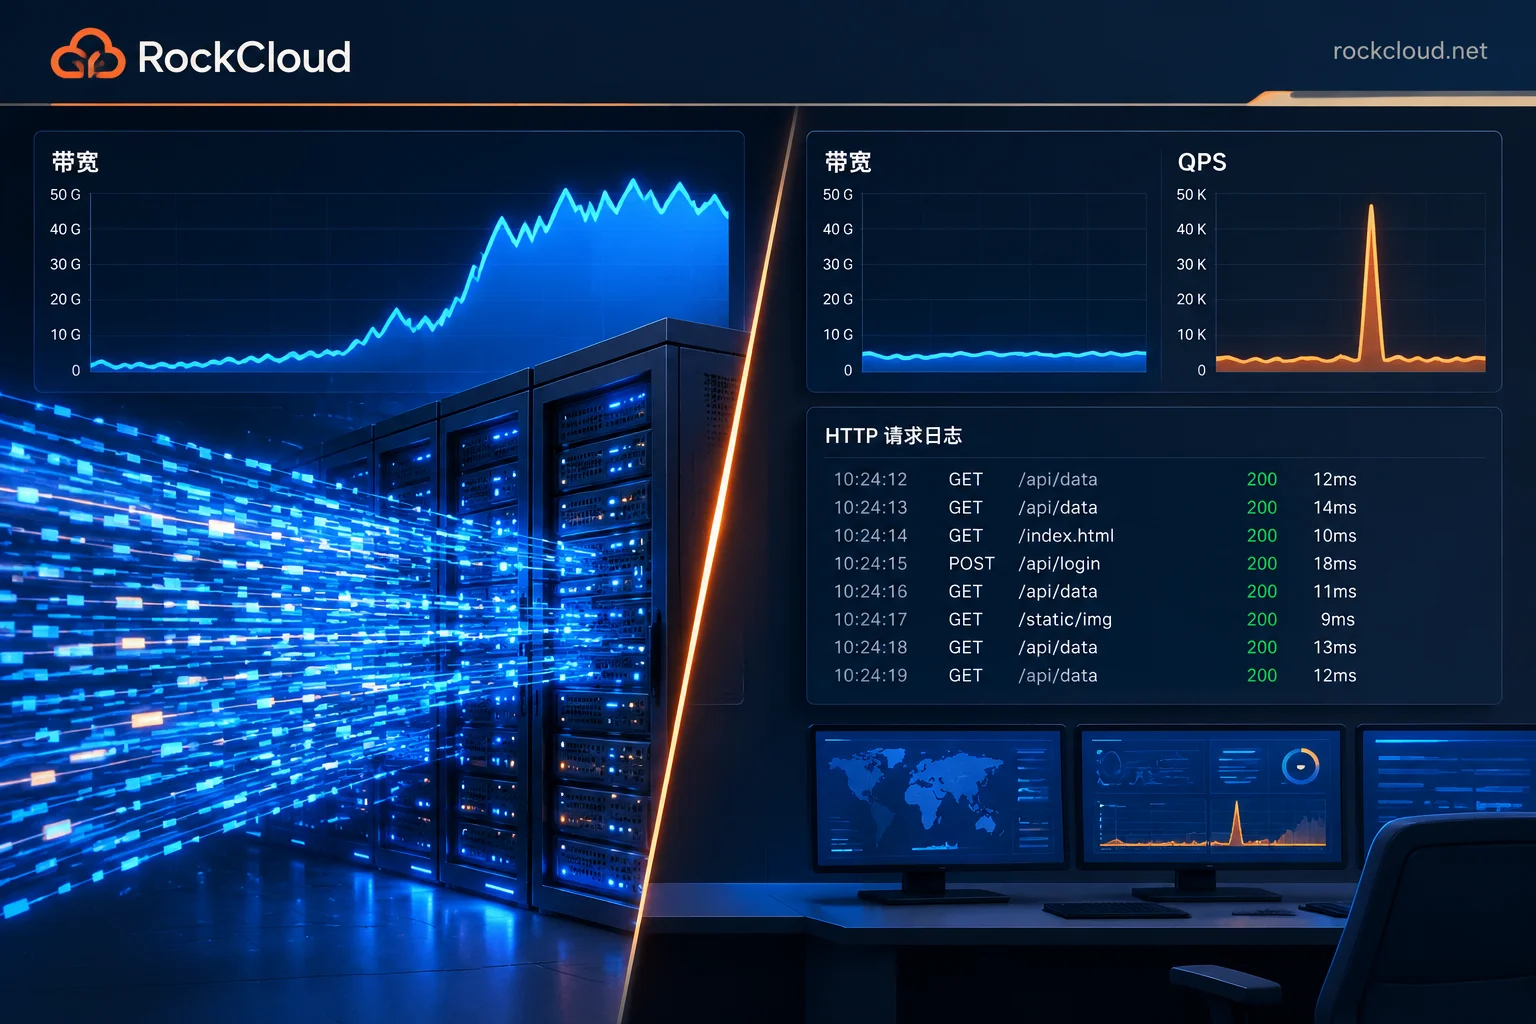
- Network-layer DDoS: bps and pps rise sharply, often in the Gbps range; layer 7 QPS may not change significantly, or may even drop, because many connections cannot even complete the handshake.
- CC attack: total bandwidth changes little, usually only between a few Mbps and hundreds of Mbps; but QPS, concurrent connections, and new HTTP requests per second show abnormal spikes.
If you do not have a dashboard, you can use sar -n DEV 1 5 (requires sysstat) or iftop on the server to view real-time NIC traffic.
Step 2: Try to log in to the server
This step is the fastest and very intuitive:
- When bandwidth is saturated, SSH or remote desktop often cannot connect, or takes a long time to respond after input. The server itself may not be busy—the network is just congested.
- During a CC attack, SSH generally logs in normally. Use
toporhtopto see php-fpm, java, python, nginx, or mysql processes consuming CPU or memory.
If you cannot log in at all, skip the next two steps and contact your data center or cloud provider directly to confirm whether traffic scrubbing or blackholing has been triggered.
Step 3: Check TCP connection states
If you can log in, count connections by state:
# 连接状态汇总
ss -s

# 按状态计数
ss -ant | awk 'NR>1 {print $1}' | sort | uniq -c | sort -rn- A large number of
SYN-RECV(shown asSYN_RECVin netstat) half-open connections: typical SYN Flood, a transport-layer attack. - A large number of
ESTAB(ESTABLISHED) orTIME-WAITfully established connections, far exceeding normal levels: the handshake is complete, requests have reached the application layer, more like CC.
Step 4: Check Web access logs
This is the most convincing evidence for distinguishing the two. Most network-layer DDoS packets never reach the application layer, so almost no attack records appear in access.log; CC attack logs expand sharply in a short time.
Using Nginx's default combined log format as an example (the log path depends on your configuration):
# 请求最多的 IP
awk '{print $1}' access.log | sort | uniq -c | sort -rn | head -20

# 被请求最多的 URL
awk '{print $7}' access.log | sort | uniq -c | sort -rn | head -20

# 出现最多的 User-Agent
awk -F'"' '{print $6}' access.log | sort | uniq -c | sort -rn | head -10
Common signs of CC attacks include:
- Requests concentrated on compute-heavy dynamic endpoints such as search, pagination, login, and checkout;
- The same URL being refreshed at high frequency;
- Highly consistent User-Agent, or clearly forged Referer;
- IPs are scattered but behavior is consistent, indicating the attacker is rotating through a proxy pool.
Several easily misjudged situations
CDN or high-defense protection is already in place. In this case, network-layer attacks are mostly absorbed at edge nodes, and the origin only sees back-to-origin traffic; IPs in logs are all node addresses, so statistics should be based on the real IP header passed by the provider. Judgment should rely on the CDN console's traffic and logs; for details, see How to check traffic and network logs in the CDN console.
Slow attacks (Slowloris and similar). They are application-layer attacks, but QPS is not high. Requests are not completed for a long time, and logs are usually written only after the request ends, so access.log does not necessarily explode. The symptom is ESTABLISHED connections staying full for a long time, Web service workers exhausted, but CPU may not be very high.
Mixed attacks. The attacker first uses layer 4 traffic as a baseline, while launching CC to overwhelm the application; the above indicators will be abnormal at the same time, and the results of a single command will be mixed. In this case, it is best to cross-check using aggregated logs from both layer 4 and layer 7.
Normal business peak. Campaigns, push notifications, or being shared by a large account can also cause QPS and CPU to rise simultaneously. Compare with your usual baseline: whether the source regions match your user distribution, and whether the access path looks like a real user (first open the page, then request static resources and APIs), rather than repeatedly hitting only the same endpoint.
How to respond after diagnosis
If it is network-layer DDoS: Traffic has already congested the line before reaching the server; installing a firewall or changing kernel parameters on the server cannot solve saturated bandwidth. You need to connect your business to a high-defense IP or high-defense CDN with scrubbing capability, and hide the origin IP; otherwise attackers can bypass protection and hit the origin directly. For the access order, see Website under large traffic attack: quick CDN mounting order and origin concealment points.
If it is a CC attack: You can first perform temporary mitigation at the origin:
- Block the IPs with the most requests;
- Temporarily add caching to the dynamic endpoints being flooded, or temporarily take non-core features offline (such as site search);
- Use Nginx rate limiting:
limit_req_zone $binary_remote_addr zone=perip:10m rate=10r/s;

location /search {
    limit_req zone=perip burst=20 nodelay;
}
Note that when there is a CDN or reverse proxy in front of the origin, $binary_remote_addr gets the node IP, so you need to configure the real_ip module first; otherwise you may accidentally block users behind the entire node. In addition, when the attacker rotates IPs through a proxy pool, blocking IPs has very limited effect. To continuously block CC, you need a WAF or high-defense CDN to perform JS verification, Cookie validation, dynamic rate limiting, and signature-based blocking at layer 7.
If the attack is still ongoing and your own diagnosis and mitigation cannot keep up, you can directly contact RockCloud for emergency access. RockCloud's high-defense CDN handles both network-layer DDoS and application-layer CC on the same link, so you do not need to purchase them separately; to learn about the solution first, see DDoS and CC defense.



Comments(0)