 RockCloud-基石云安全-官方博客
Checking the connection state layer is the first step; don't look at access logs first. When ops find the server response slow, connection count piling up but bandwidth and QPS not high, the entry point for determining slowloris CC attack must shift from log layer to connection state layer. This is because before attackers finish sending request headers or body, the web server doesn't generate access log entries, making QPS-threshold-based detection ineffective in this scenario. This article focuses on how to determine if it's a slowloris CC attack, providing actionable metrics and scenario-based mitigation paths.
Why Slowloris CC Is Invisible in access.log
The stealth of slow attacks stems from when web servers write logs. Taking Slowloris as an example, attackers establish numerous TCP connections, then periodically send incomplete HTTP request headers while keeping Keep-Alive alive, making connections persist but requests remain in an "incomplete" state. Since request headers never complete, Nginx or Apache won't trigger log writing, so access.log naturally won't show these malicious requests. This directly explains why "checking CC by flipping through access.log for high-frequency IPs" is a common misconception: slow attacks' traffic signature lies not in request rate, but in connection occupation duration. Determination must shift to the connection state layer, observing long-lived ESTABLISHED connections, incomplete requests, and growth curves of worker connections and file descriptors.
Non-Attack Causes to Rule Out First When Connection Piles Up but Bandwidth/QPS Is Low
Before determining an attack, rule out connection buildup due to business or network environment to avoid misjudgment. Different causes have distinguishable connection distribution patterns:
| Non-Attack Cause | Connection Distribution | Identification Points |
|---|---|---|
| Application connection pool not released | Source IPs concentrated on internal application servers | Mostly ESTABLISHED but Recv-Q/Send-Q empty |
| Backend dependency slow response | Connections waiting concentrated on specific API paths | Database or third-party API monitoring shows delay |
| Keep-Alive timeout too long | High idle connections but no data exchange | Connections close normally after timeout, no continuous data writes |
| Health checks and crawlers with long connections | Fixed monitoring or crawler IP segments | UA identifiable, requests eventually complete |
| Weak network clients on internal | Slow connection establishment but eventually successful | Affects only specific office segments, not scattered public IPs |
If the above scenarios are ruled out and connections continue piling up without corresponding business, only then proceed to slowloris CC determination.
Criterion 1: Reading Long-lived ESTABLISHED and Incomplete Requests in ss -tan
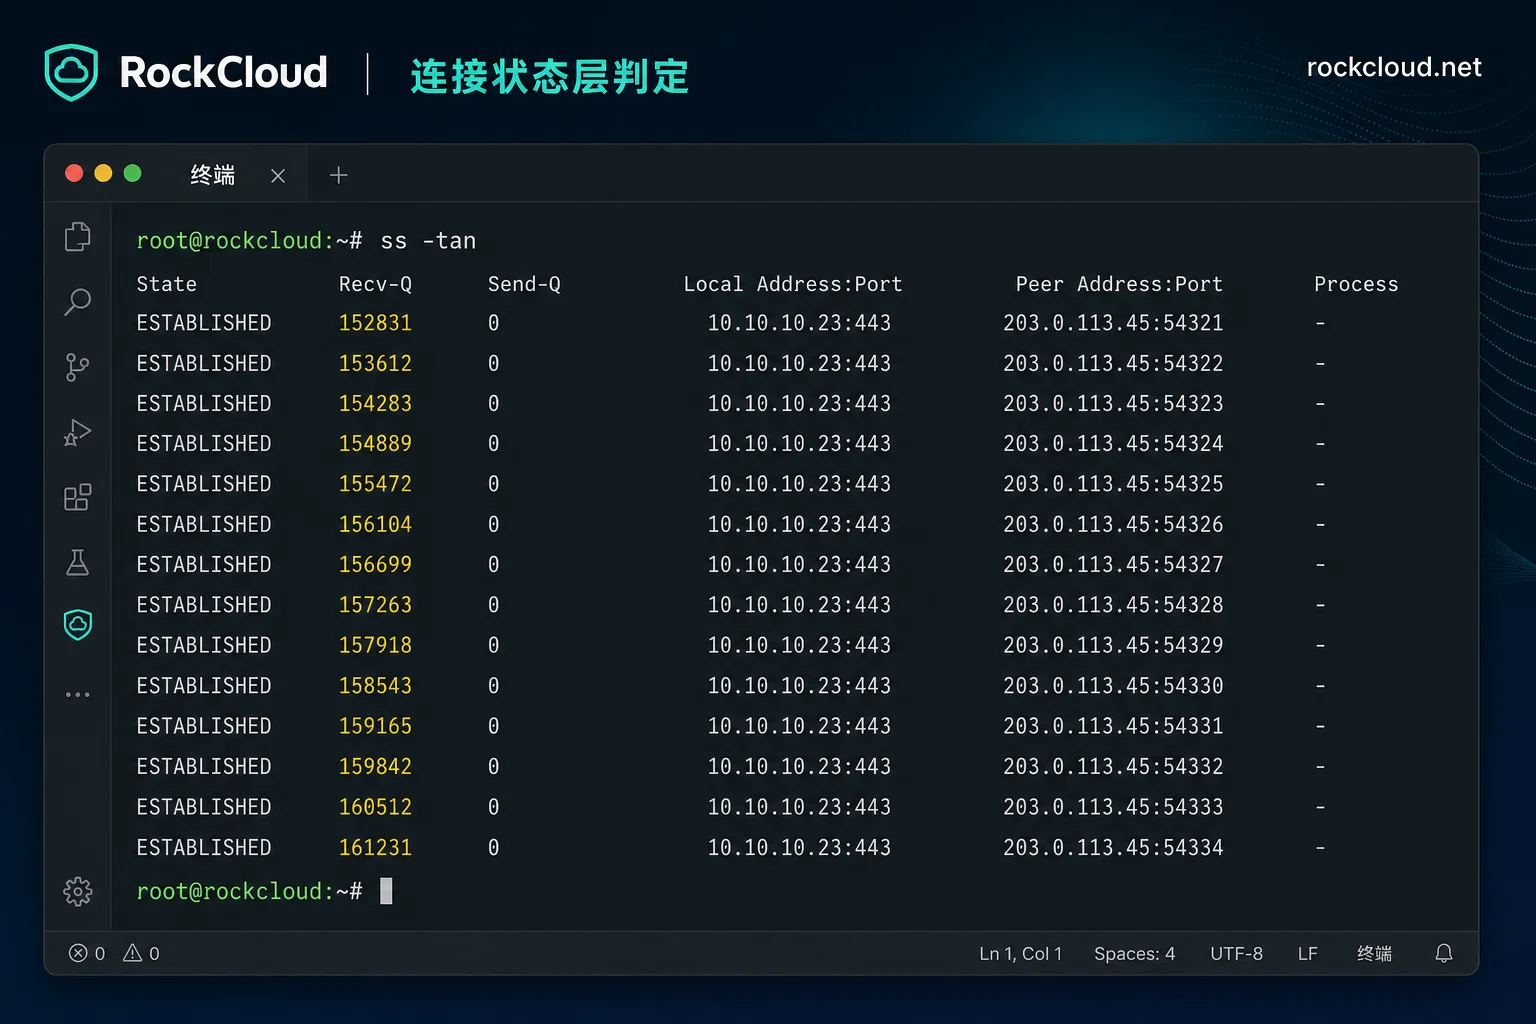
Using ss -tan to count connections by state is a core observation action. Focus on three dimensions: number of ESTABLISHED connections aggregated by source IP, connection establishment duration, and Recv-Q/Send-Q queue distribution. The core fingerprint of slowloris CC is "connections persist but requests never complete," showing many ESTABLISHED connections with Recv-Q continuously receiving small amounts of data but no full request, while Send-Q remains non-zero waiting for response. Sample multiple times to see trends; a single snapshot may be affected by transient fluctuations. If a few IPs hold up many long-lived ESTABLISHED connections with slow-growing queue data, that points to a slow attack. This troubleshooting method directly addresses the practical question of how to handle many ESTABLISHED connections in ss -tan.
Worker Connection Usage and File Descriptor Growth Curves
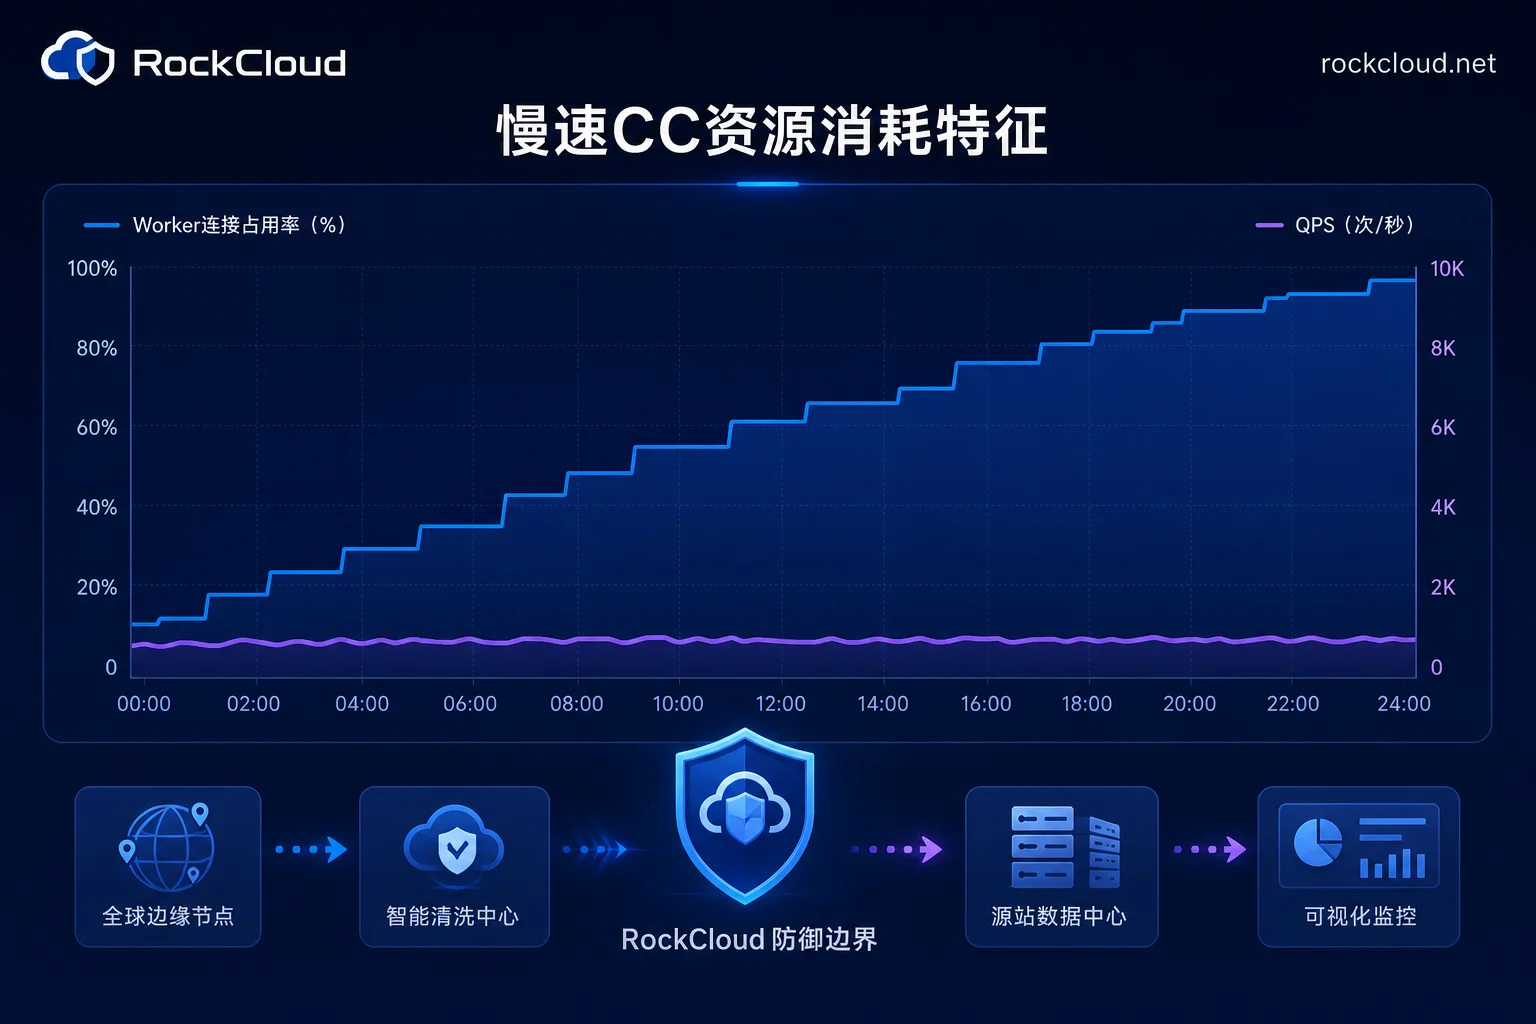
The second set of criteria focuses on process resource consumption patterns. Nginx's active connections and reading state counts, Apache worker utilization, and process FD counts are core metrics. Under slow attacks, these metrics rise stepwise and don't fall, because occupied connection slots aren't released proactively; normal business peaks show smooth curves that rise and fall with traffic. If worker utilization stays near the cap but QPS doesn't correspondingly increase, threads are likely blocked by incomplete requests. If file descriptor growth rises linearly with ESTABLISHED connections without close events, that further corroborates a connection-exhaustion attack. Align resource curves with connection state sample times to avoid misjudging memory leaks as attacks.
Boundary Between Single-IP Connection Count and Request Header Arrival Rate
Gray area handling is tricky. Real weak-network users also have slow connections, but they show few connections, requests eventually complete, and UA and paths are scattered; slow attacks have a few IPs propping up many concurrent connections, with request headers slowly trickling in at a fixed rhythm and never ending. Distinguishing dimensions include: single-IP connection count threshold (needs to align with business baseline), regularity of request header arrival rate, and distribution of connection survival time. Don't block based solely on connection count; cross-validate whether requests eventually complete. If connections can't complete requests before timeout and rates follow a mechanical pattern, attack probability is much higher than weak network.
Comparison: Slowloris CC, HTTP Flood, SYN Flood, and Connection Pool Leak
| Attack/Fault Type | Bandwidth | QPS | Connection State Distribution | access.log Visibility | CPU/Memory | Recovery |
|---|---|---|---|---|---|---|
| Slowloris CC | Low | Low | Many long-lived ESTABLISHED | Invisible | Connection exhaustion but CPU low | Tighten timeouts + edge buffering |
| HTTP Flood | Medium | High | Normal ESTABLISHED + TIME_WAIT | Visible high-frequency IPs | CPU spikes with QPS | Rate limiting + CAPTCHA |
| SYN Flood | High | None | Many SYN_RECV | Invisible | Memory exhaustion | L4 scrubbing |
| Connection Pool Leak | Low | Low | Internal IPs ESTABLISHED | Invisible | Memory slowly grows | Restart application |
Note cross-validation of metric combinations: Slowloris CC and connection pool leak look similar in connection state, but source IP distribution and request completion are key differentiators; QPS difference is the primary distinguishing factor between HTTP Flood and Slowloris CC.
Origin Timeout Tightening and Extent of limit_req Rate Limiting
Origin-side measures can only delay thread exhaustion, not eradicate the attack. Tightening read timeouts for request headers/bodies, limiting concurrent connections per IP, and using ngx_http_limit_req_module with a leaky bucket to control processing rate per $binary_remote_addr, paired with burst/nodelay to smooth legitimate bursts, returning 429 or 503 on exceedance, are standard measures. But these have an upper bound: attackers can bypass timeouts by adjusting send rate, or evade per-IP limits via distributed source IPs. The real breaking point lies in whether connections can be fully buffered before hitting origin, which origin side cannot achieve.
Choose Approach by Scenario: Self-hosted Origin, Dynamic APIs, and Already Behind CDN
| Scenario | Priority Actions | Confirmation Signals | Continuous Metrics |
|---|---|---|---|
| Single-server self-hosted Nginx/Apache | Tighten timeouts + limit_req + per-IP concurrent limits | ESTABLISHED count drops | Worker utilization, FD count |
| Dynamic API business | API-level rate limiting + request body size limits + timeout tightening | Queue of incomplete requests clears | API P99 latency, connection pool usage |
| Behind CDN but still directly accessed | Origin IP whitelisting + firewall rules + CDN origin authentication | Public direct connections drop to zero | Origin inbound connections, CDN origin fetch error rate |
| Non-HTTP proprietary protocol | L4 high-defense IP + protocol compliance checks | Anomalous connection termination rate rises | L4 connection count, protocol parsing failure rate |
For the scenario of already behind CDN but still directly accessed, first investigate whether the origin real IP is leaked; refer to how to prevent origin IP exposure for hiding techniques. For WebSocket long-connection businesses, slow attack characteristics differ from HTTP; combine with WebSocket long-connection DDoS protection plan for cross-validation using connection state criteria.
FAQ
Website slow but bandwidth and QPS low, what's the cause?
Prioritize checking slow connection exhaustion. Slowloris CC attacks occupy connection threads with incomplete requests, causing low bandwidth/QPS but connection buildup. Check ss -tan for long-lived ESTABLISHED connections and worker utilization curves; after ruling out connection pool leaks and slow backend dependencies, if connections rise stepwise and don't fall, it's basically a slow attack.
access.log shows no requests but connection count is high, why?
This is typical of slowloris CC. Web servers don't write logs before request headers complete, making requests invisible in access.log. Shift to connection state layer: use ss -tan to count ESTABLISHED connection durations and Recv-Q data rates. If many connections persist but requests don't complete, with abnormal source IP distribution, log-layer detection is confirmed ineffective.
How to troubleshoot many ESTABLISHED connections in ss -tan?
Sample at least 3 times consecutively, aggregate connections by source IP, and note durations. Focus on connections with Recv-Q continuously receiving data but no full request, and Send-Q non-zero waiting for responses. Distinguish weak-network users: attack connections follow a fixed rhythm and never complete, while weak-network connections eventually succeed. Don't block based solely on connection count; cross-validate request completion.
What's the difference between Slowloris CC and HTTP Flood?
Core difference is request completion and log visibility. HTTP Flood sends complete high-frequency requests, QPS spikes and access.log visible; Slowloris CC sends incomplete requests, QPS low and log invisible. In connection state, HTTP Flood shows normal ESTABLISHED + TIME_WAIT, Slowloris CC shows long-lived ESTABLISHED with incomplete queues. For mitigation, rate limiting works for HTTP Flood but for Slowloris CC you need tightened timeouts plus edge buffering.
Can high-defense CDN prevent Slowloris CC attacks?
Yes, but only if requests are fully buffered at the edge. The breaking point for slow attacks is whether connections are fully buffered before hitting origin. RockCloud High-Defense CDN's edge scrubbing layer can front-load complete request buffering, connection termination, and slow connection reclamation, leaving origin with only origin-fetch convergence. However, if origin still exposes public ports, attackers can bypass CDN and directly connect; then you need to combine origin hiding strategies from CDN security acceleration, otherwise edge protection will be bypassed.
It's recommended to first run a live determination using the connection-state criteria in this article to confirm slow connection exhaustion, then decide mitigation level; if origin timeouts and concurrent limits are already tightened but connections are still saturated, consider front-loading request buffering and connection termination to the edge, and contact RockCloud technical support to verify origin-fetch convergence configuration.




Comments(0)